Created: 2022-11-03 14:11:82 Tags: #ML #DataScience #classification_metric #ml_metrics
For understanding ROC curve you need to read Confusion Matrix note firstly.
# Definition
A Reciever Operating Characteristic curve is a graphical plot that illustrate the diagnostic ability of binary classifier as its discrimination threshold variate.
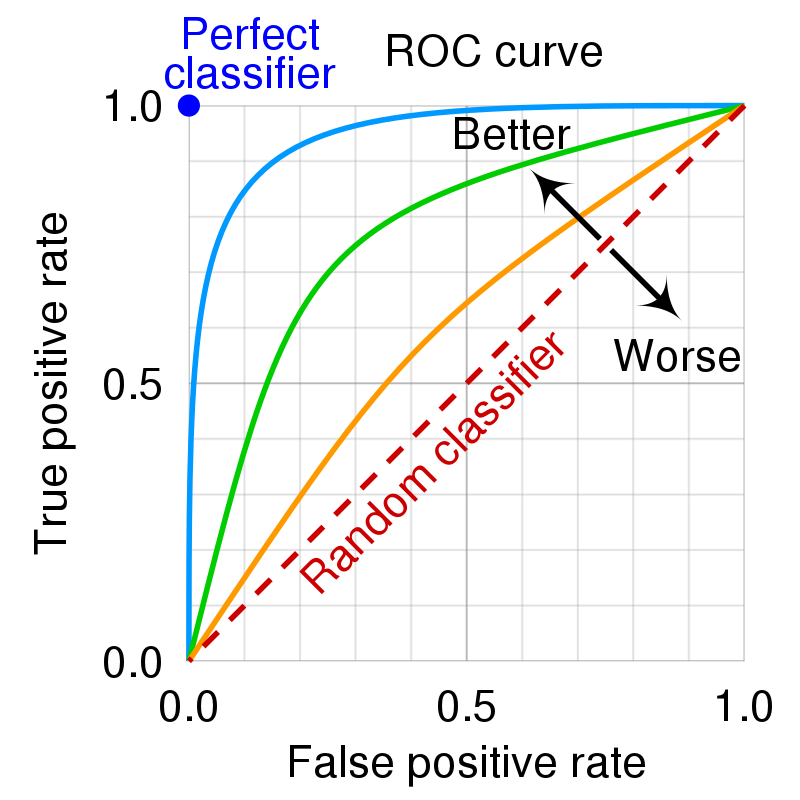 You can create ROC curve by plotting TPR (True Positive Rate) against FPR (False Positive Rate) at various threshold settings.
The perfect ROC curve plot should pass through points (0, 0), (0, 1) and (1, 1) at any threshold settings while random classifier should pass through point (0, 0), (0.5, 0.5) and (1, 1). Also ROC curve plot should always be upper that random classifier curve.
If you got ROC curve under random classifier curve, you need to swap class labels.
# Plotting process
How i wrote earlier, ROC curve can evaluate model at differnet threshold settings. The plot creates by repeating these simple steps:
- Define threshold for positive class label, for example, 0.01
- Make predictions at all data set with chosen threshold
- Calculate TPR and FPR
- Put point on plot
- Repeate 1 - 4 steps increasing threshold at 0.01 on each new iteration while
# Probabilistic interpretation
Area under curve is equal to the probability that classifier rank a randomly chosen positive sample higher than a randomly chosen negative sample
# ROC AUC (Area under ROC curve)
AUC repsent probabilistic interpretation of ROC curve and can be used for binary model evaluation. For given binary model $f$: $$AUC(f)=\frac{\sum_{t_0 \in \mathcal{D}^0}\sum_{t_1 \in \mathcal{D}^1}\mathcal{1}[f(t_0) < f(t_1)]}{|\mathcal{D}^0|*|\mathcal{D}^1|}$$ where:
- $\mathcal{1}[f(t_0) < f(t_1)]$ is the function that return 1 if $f(t_0) < f(t_1)$ else return 0
- $|\mathcal{D}^0|$ is the set of negative examples
- $|\mathcal{D}^1|$ is the set of positive examples
AUC=0.5 means that our classifier works randomly
The AUC is related to the Gini impurity index by the formula: $$G_1 = 2AUC - 1$$ where: $$G1 = 1 - \displaystyle\sum_{k=1}^{n} (X_k - X_{k-1})(Y_k - Y_{k-1})$$