Created: 2022-11-01 15:11:91 Tags: #ML #DataScience #confusion_matrix #classification_metric
# Note
In the field of machine learning, confusion matrix also know as an error matrix, is a specific table layout that allows visualization of performance machine learning algorithm.
Each row of the matrix represents true class label while each column represents predicted class label.
Confusion matrix visualization:
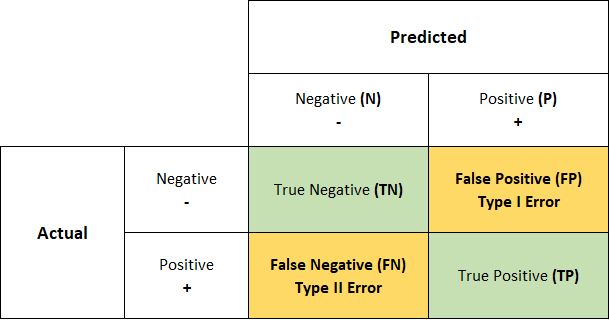
# TP (True positive)
Sample where model classified it as positive and it is actually positive.
# FP (False positive)
Sample where model classified it as positive but it is negative (Type 1 error)
# TN (True negative)
Sample where model classified it as negative and it is actually negative.
# FN (False negative)
Sample where model classified it as negative but it is positive (Type 2 error)
We should always minimize FP and FN rate, but in real cases it is important to minimize only one of these metrics.
Now we can use TP, FP, TN and FN definitions to define classification metrics such as Accuracy score, Precision and Recall.
# TPR (True Positive Rate)
Also know as sensitivity (or Recall) defines as: $$TPR=\frac{TP}{TP + FN}$$
# FPR (False Positive Rate)
Also known as fall-out ration defines as: $$FPR = \frac{FP}{FP + TN}$$
We can use TRP and FPR to define ROC Curve & ROC AUC